Virginia Climate

Climate-Related Reports

Climategate


Climategate centers around the story of the hacking or whistle-blowing of about 168 MB of files containing emails, computer code, and documents at the University of East Anglia’s Climate Reseach Unit (UEA-CRU).  An important thing to understand is that the emails also incriminate other organizations around the world, including NCAR (NOAA’s National Center for Atmospheric Research).  For some detail on the background of the matter of claims of man-made or Anthropogenic  Global Warming (AGW) click on Report 3 above.


Climategate, climate, and energy Youtubes can be reached by clicking here


For a list of Climategate and other Climate stories at American Thinker, click here


For a list of Climate-Related stories at American Spectator, click here


Climate ,

Man or Nature?


Earth’s climate is a multi-parameter  thing.  It is temperature,  rain, relative humidity, wind, ocean currents, atmospheric pressure, and atmospheric molecular constituents,.  It is the soil, the ocean, and the air.  It is our sun and deep space.


Earth’s climate is a dynamic phenomena.  It is never the same, a state of all of the above in a constant state of change, compensation, balance , and lack of balance.    Surprisingly, it is a stable dynamic - it seems to exist within a set of boundary conditions.  Luck for us!


If there is one of the parameters we associate most with climate it is temperature.  So for the rest of this  discussion will center on ‘temperature’.  We will develop this discussion as we conclude results from data mining and our own studies.


Climategate


Report 4 provided at the top of this page provides a description of what Phil Jones at the CRU referred to as “Mann’s Nature Trick” (MNT) in one of the Climate Gate Emails.  MNT was a falsification of temperatures he found from tree-ring proxy data.  Mann’s temperature data did not match that measured by instrumentation for the past 100+ years.  He purposely average his data and the instrumentation data where it overlapped in order to show a match  That is  the MNT and it is an absolute fraudulent method.  Moreover, he did not show all of his data and did not use it in the fraudulent manner.  He has data for more recent years than he showed and these data turns down to lower temperatures while the instrumentation data shows an increase.  Phil Jones went further with the MNT and did not distinguish what was proxy data and what was instrumentation data - so it appeared his proxy data was absolutely correct thorough out history, including the recent 100 years.


The message behind all of the Mann and Jones fraud is that none of the data is correct and it hides the cycling of temperatures from warmer times and colder periods than any we have experienced in the past 100 years.  These are periods called ‘Medieval  Warming’ and ‘The Little Ice Age’.


And what about those instrumentation-measured values for the past 100+ years?  The CRU, NASA’s Goddard Institute Space Science (GISS), and NOAA’s National Climatic Data Center (NCDC) report ‘adjusted’ Global and Regional Temperature Averages.  All three use the raw data gathered by the NCDC, but ‘adjust’ using their particular protocols.  [All three report ‘temperature anomalies’ (TA) and opposed to ‘temperatures’.  AT is obtained by first determining the average temperature for some time period, 1961-1990 for CRU and NCDC and 1982-1992 for GISS.  This average is subtracted from the actual temperature and the results, which is a relative value, and is called the AT.]


Contiguous U. S. Temperature


The question is - are the instrument-measured values correct?  A Russian Paper challenges the global values produced by the CRU.  [Click here for the WEB page for the Russian paper.  Paper ‘1’ is the original and paper ‘2’ is a translation into English.]  The paper shows that the CRU purposely selected Russian meterological stations for data so as to generate a large historical rate of temperature increase.  So, the rates of temperature from the instrument-measured data in the MNT work and the work by Jones are probably as fradulent as the other aspects of the CRU work.


The Russian work caused me to wonder if the Contiguous U. S. temperature data published by the NCDC is any more accurate or correct.  Paper 5 at the top of this page details a study of the Contiguous U. S. I have done using NCDC data.  For this study I selected two sets of 48 metrological stations, one for rural sites and another for urban sites.  For each set I used the Raw NCDC data set and their ‘adjusted’ data set.


The Raw set is that data measured, recorded, and documented at the respected stations for the period from 1895 to 2008.  The Adjusted set is that data resulting from the Raw set after the NCDC has applied its protocols to adjusted the data for time-of-day, location adjustment, type of equipment, etc.  Then values for the missing dates are inserted on the basis of data from surrounding stations and other forms of estimation.


The rates of temperature increase (Deg C per century) determined for the two sets of stations, using Raw and Adjusted data are shown in the following Table.   Included in the Table is the NCDC.

                                                Raw        Adjusted

Rural                                        0.13              0.79

Urban                                       0.64              0.77

Rural & Urban Combined       0.52              0.71

NCDC                                         -                 0.69


The NCDC results is a combination of rural- and urban-sited stations.  It may or may not be an equal amount of each type and at this time without conducting a tedious inspection it would be difficult to make an assessment.   But notice the NCDC value or 0.69, is only 2.8 % less than the Rural & Urban Combined Adjusted value, 0.71.  Thus the following assessment seems fair:


The NCDC Adjusted data alters the Rural site data so it is urban in character.  In other words, Nature has been made to look more like the environment caused by an urban-island warming.  Thus, the NCDC value is a reflection of urban heating and not an effect of increasing CO2 level.  Nature itself, I.e. The Contiguous U. S. warming , 0.13 Deg C per century, is insignificant value.  It does not justify the incrediably damaging and costly effect of the Waxman-Markey Bill which passed the U. S. House of Representatives in 2009.  Report 1 at the top of this page provides an assessment of the economic effect of the Waxman-Markey Bill.


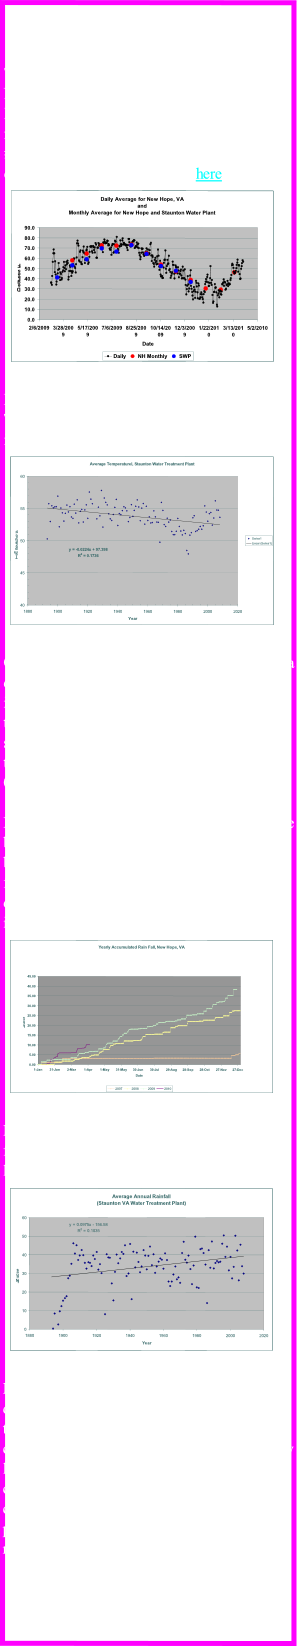
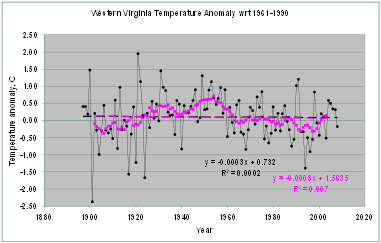
And before leaving this consideration of temperature increase per century consider 
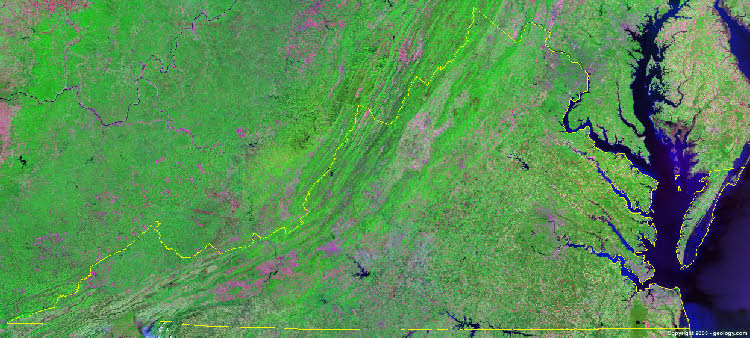
the following graph.  It is the average for 5 NOAA metrological stations in the western portion of the Commonwealth of Virginia: Woodstock, Staunton, Lexington, Hot Springs, and Burkes Garden.  The beauty of these stations is there are only three years in the raw  data, one for Staunton and 2 for Hot Springs, for which data are missing.  The yearly average is -0.03 Deg C/century.  In other words, no increase in temperature.


For a discussion of Global temperature reported by CRU, GISS, and the NCDC click here, and select Report  3.


For a discussion of the Urban Heat island Effect and its role in the NCDC projections of Climate Change click on Paper 6 at the top of this page.


What Causes Temperature Change?


To be continued when there is time to add to this page.